Authored by Megan A. M. Kutzer
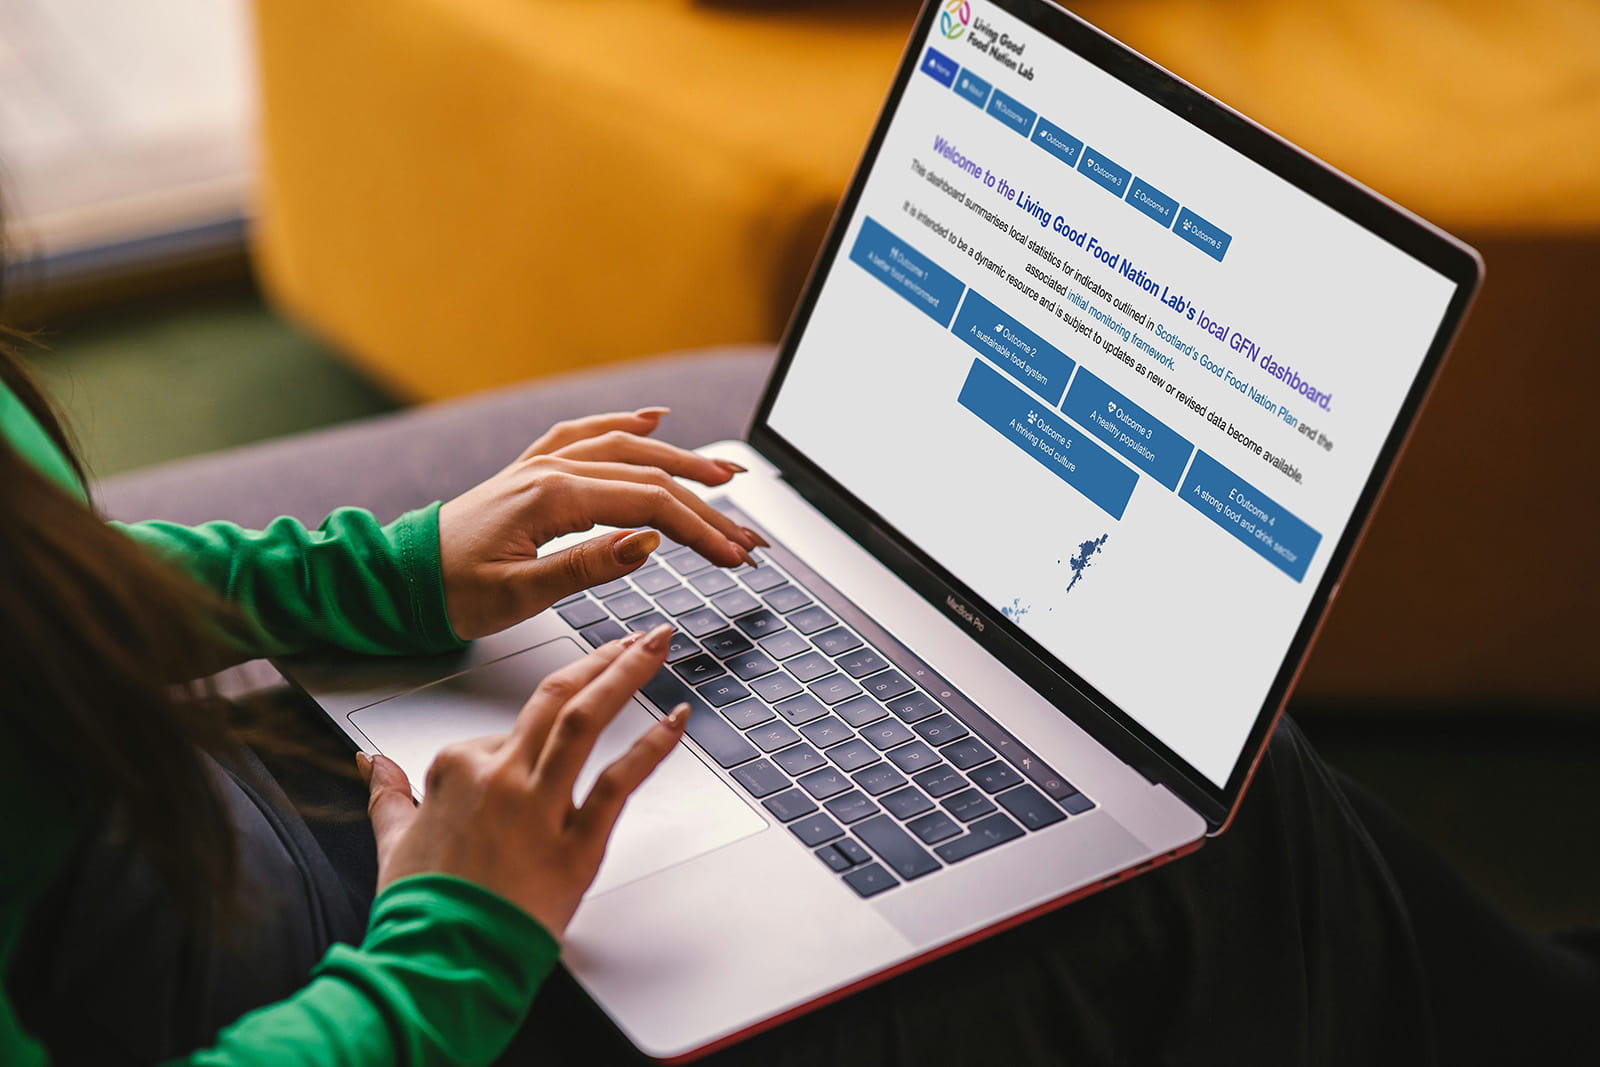
The Local Good Food Nation Dashboard was developed to support local Good Food Nation planning by bringing together relevant public data for Local Authorities and Health Boards. The aim was to make it easier to explore local baselines, compare patterns across time and place, and identify where evidence is available to support planning and decision making. By consolidating data that would otherwise need to be located, checked and interpreted across multiple sources, the dashboard can improve efficiency by reducing the preparatory work required of Local Authorities and Health Boards when developing Good Food Nation plans. The precise amount of time saved will vary, but the dashboard provides ready-to-use access to relevant local evidence that would otherwise require substantial data gathering and processing.
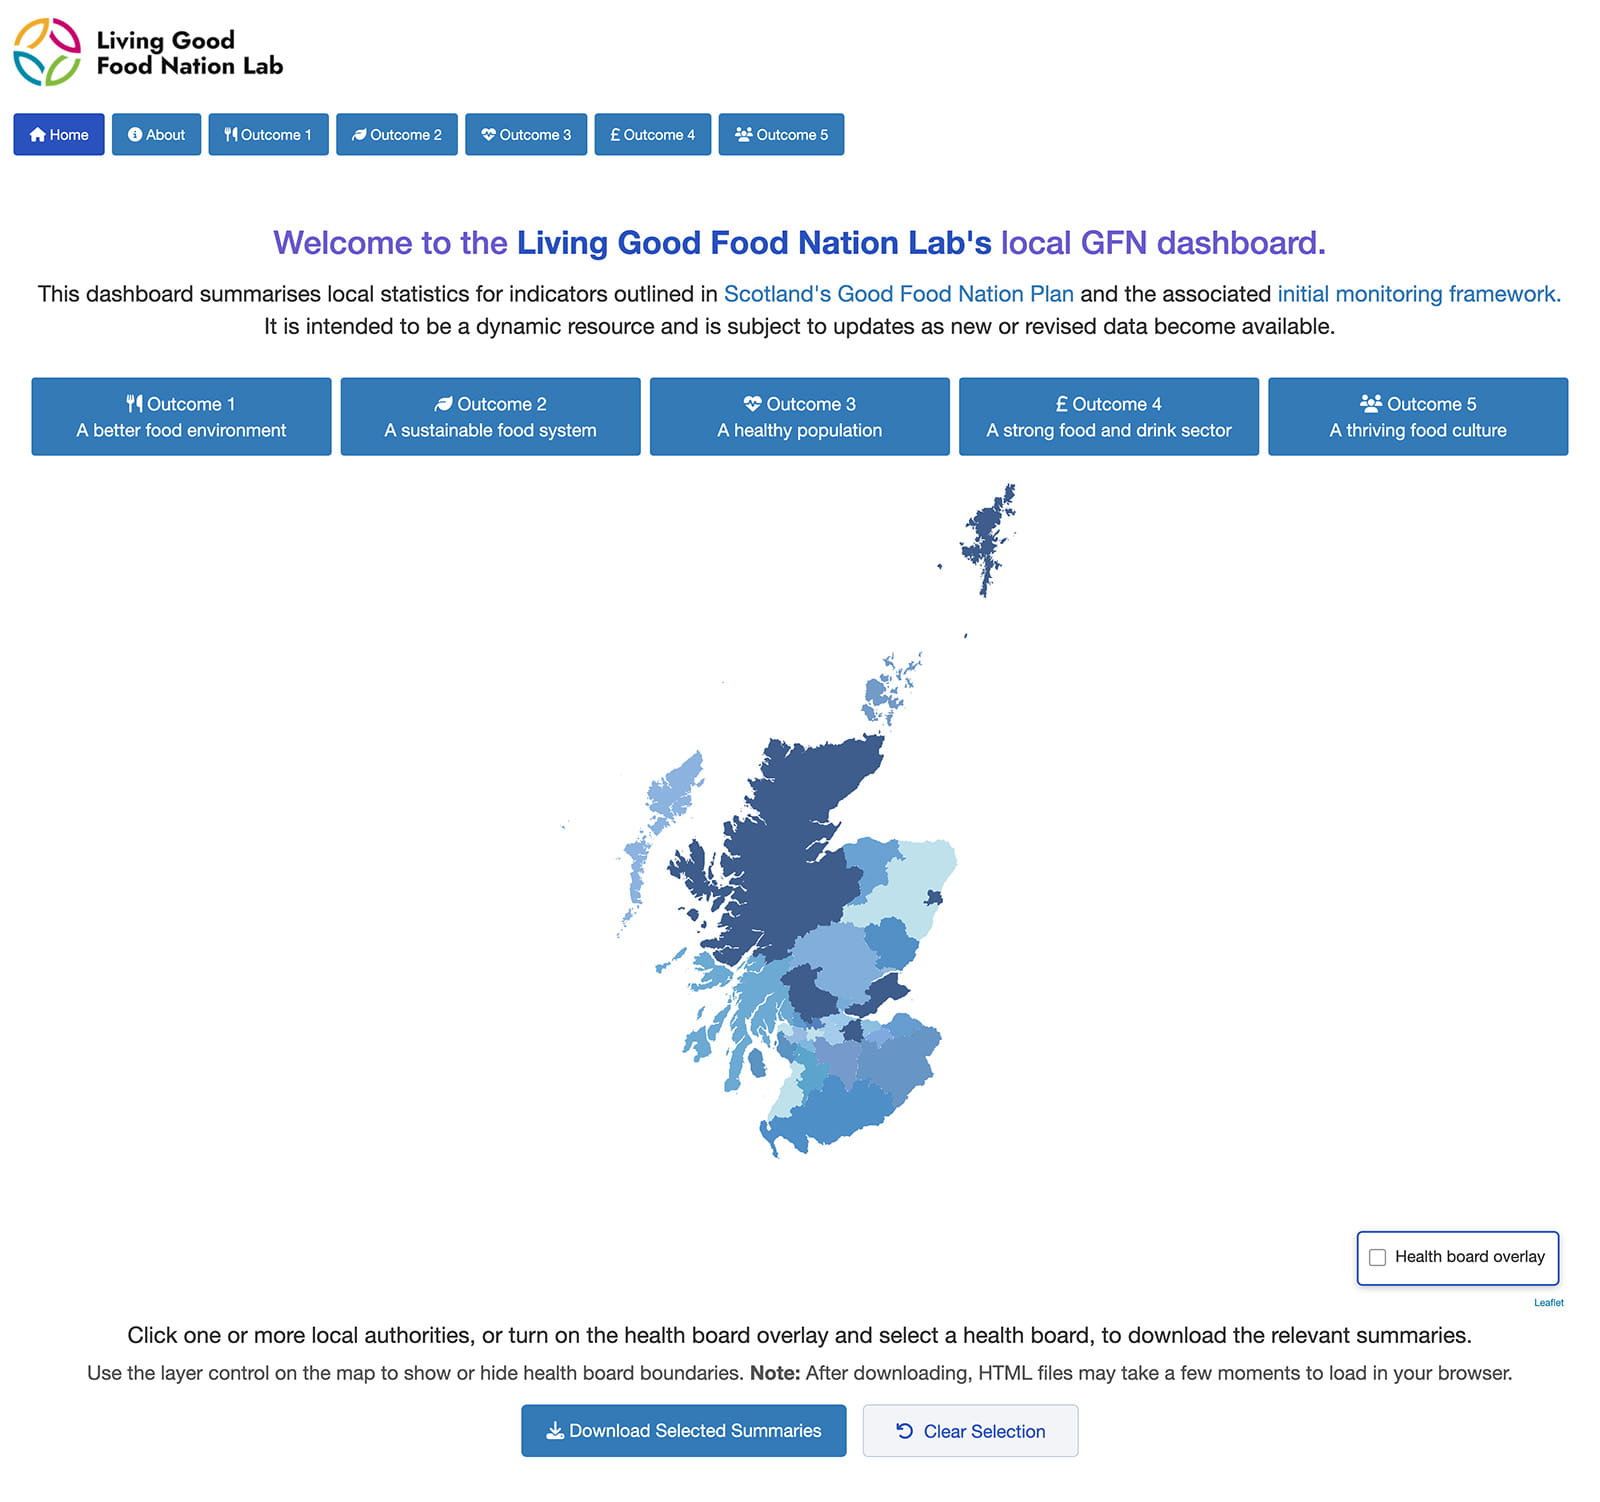
In practice, developing the dashboard quickly became more than a visualisation exercise. It became a process of testing how far the indicators in the initial GFN monitoring framework could be translated into accessible, comparable local evidence. This was not always straightforward. Many indicators are meaningful at a Scotland-wide level, but the data needed to monitor them locally are often unavailable, inconsistently formatted, or organised around geographies that do not align with Local Authorities or Health Boards.
A major challenge has been the lack of centralised structure for public food system data. Relevant datasets come from many different organisations, including Public Health Scotland, National Records of Scotland, Scotland’s aquaculture, the Crofting Commission, the UK Government and the Scottish Government. Each source has its own formats, naming conventions and reporting structures. These can also change between survey years, meaning that apparently simple tasks, such as matching area names or comparing time points, require careful checking.
Some of these organisational structures exist for understandable historical reasons. For example, bovine tuberculosis data are organised by county rather than Local Authority or Health Board, while crofting data are organised by agricultural parish. These geographies may reflect how systems were historically administered, but they do not always map neatly onto the authorities now responsible for local Good Food Nation planning. Similar issues arise in other areas: fishing data are often organised by port district, which may cross Local Authority boundaries or even coasts, and agricultural regions follow yet another geography.
Other challenges are more basic but still time consuming. Local Authority and Health Board names are not always standardised across datasets, or even across years within the same dataset. Aquaculture data often require cross-checking between sources to confirm locations, and categories such as major mortality events are not consistently recorded. This means that the dashboard cannot simply read in public data and display it. The data have to be cleaned, checked, recoded and sometimes manually verified before they can be used reliably. These issues matter because they shape what can be monitored locally. The initial monitoring framework understandably focuses on national indicators, but local implementation requires data that can be meaningfully linked to local planning geographies. The dashboard is therefore both a practical tool and a diagnostic one. It brings together the data that are currently usable, while also showing where better, more standardised data would strengthen future monitoring.
For Local Authorities and Health Boards developing Good Food Nation plans, the practical benefit is that a range of relevant local evidence can now be accessed in one place, rather than assembled separately from multiple public data sources. Users can view available indicators for their area, examine trends over time, and compare local patterns where appropriate. This supports the development of local baselines, helps identify areas that may warrant further attention, and provides a clearer starting point for priority-setting and monitoring. Importantly, the dashboard identifies local data gaps, helping relevant authorities to distinguish between an absence of need and an absence of appropriate data.
The dashboard can be accessed using the link above. We welcome feedback from Local Authorities, Health Boards and other users on how the dashboard supports local Good Food Nation planning, including which indicators are most useful and where additional local evidence would strengthen future development. Please leave us feedback at: Local Good Food Nation Dashboard Feedback – Fill in form.